Fixed Income Management: Standard Fee Comparison for Risk Pools
As a resource for your risk pool, we've compared fixed income investment management fees, across various portfolio sizes, among managers in the insurance and risk pooling space. Whether conducting a search or routine due diligence, it is important to understand where your insurer or risk pool's fees fall within the industry landscape.
We've also included the fixed income management fee comparison from our proprietary Risk Pooling Peer Group Database. This peer group compares manager fees, as well as other key investment metrics. Risk Pool Peer Group Access can be requested here >>
These standard fee schedules and comparisons were compiled from SAA's proprietary database of investment-grade fixed income managers with insurance specialization, called Manager Select. Risk Pools can access Manager Select as part of InsurerCIO's complimentary membership. Database Access can be requested here >>
Manager Select provides fee estimates for each firm (based on their submitted fee schedule and portfolio size), as well as an overview of performance, organizational structure, investment philosophy, and much more.
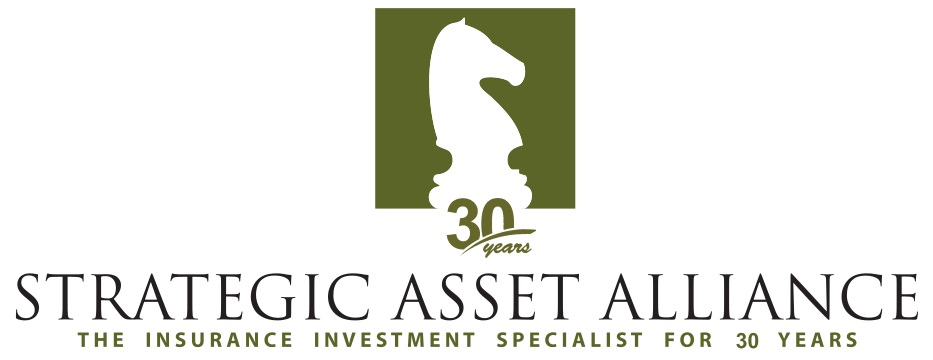
 Risk Pool Peer Group: Fixed Income Management Fee Comparison
Fees are as of 9.30.21 | This Risk Pool Peer Comparison includes 22 Risk Pooling Clients across 44 investment portfolios, totaling $5.1B in fixed income assets.
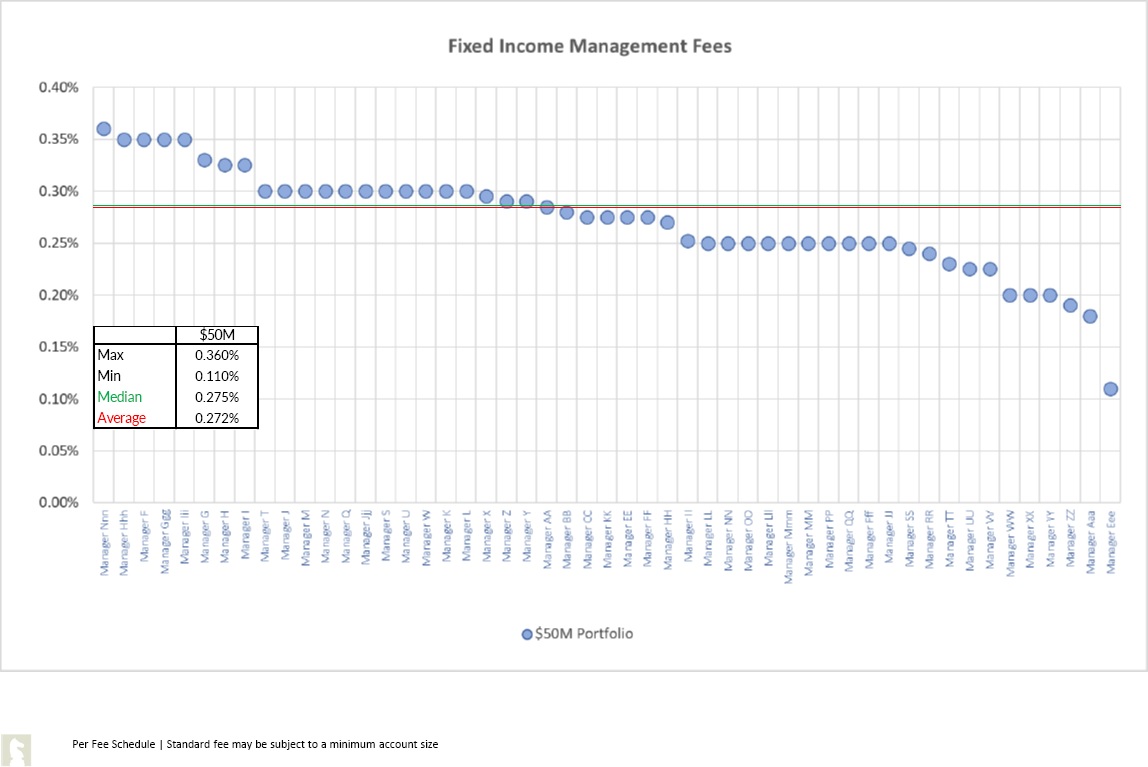
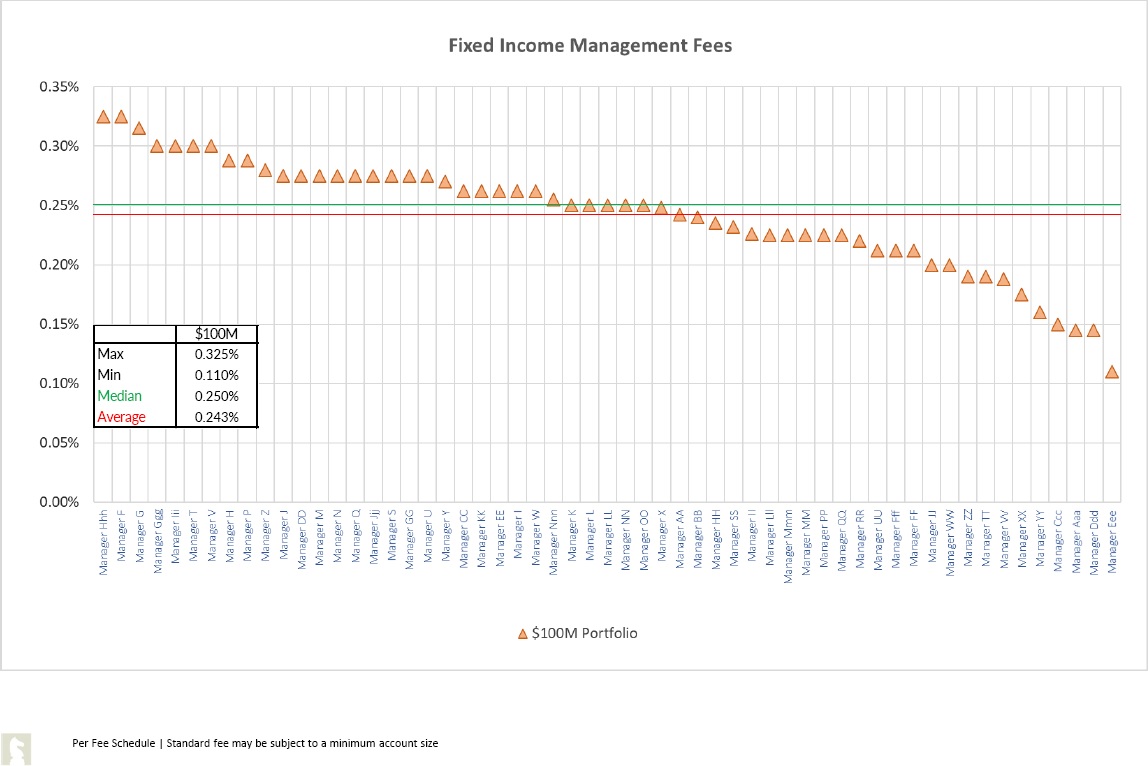
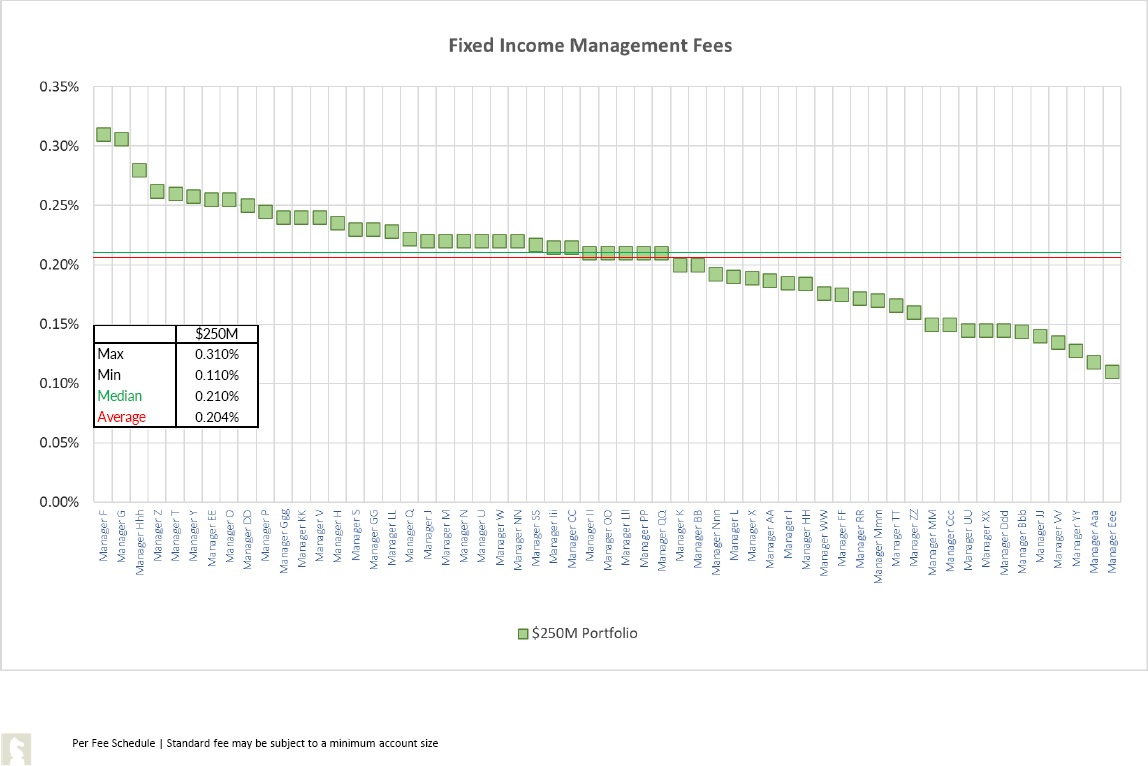
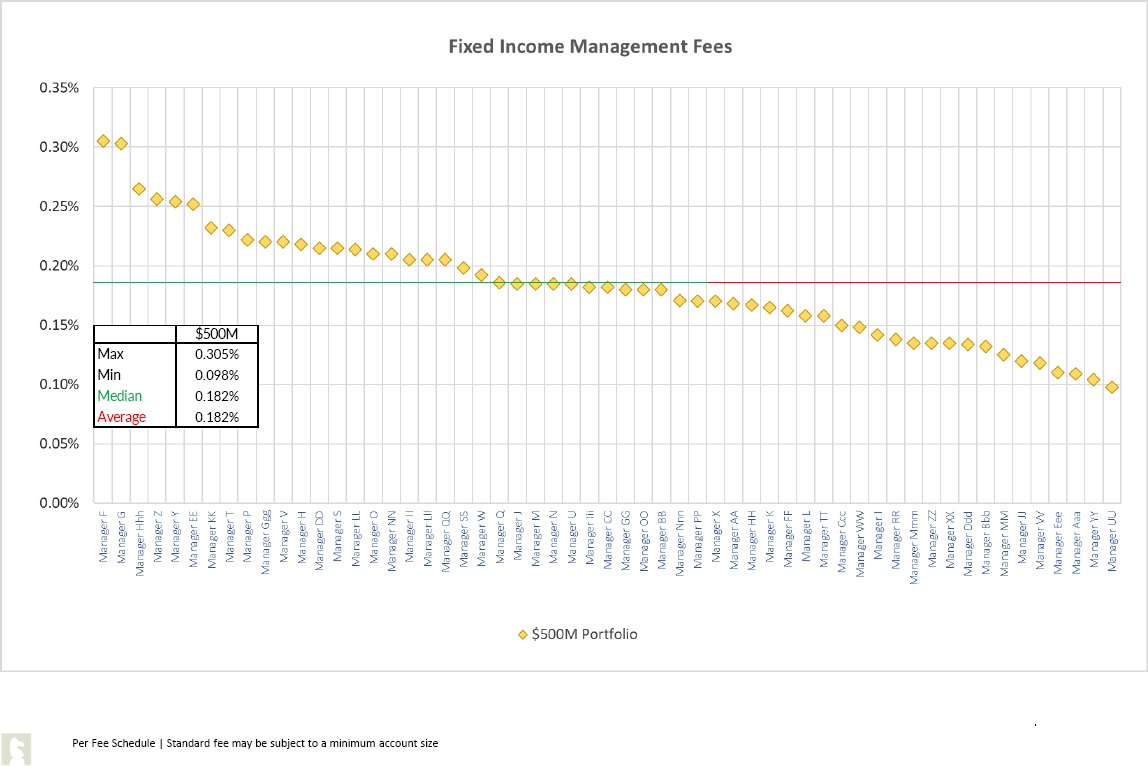
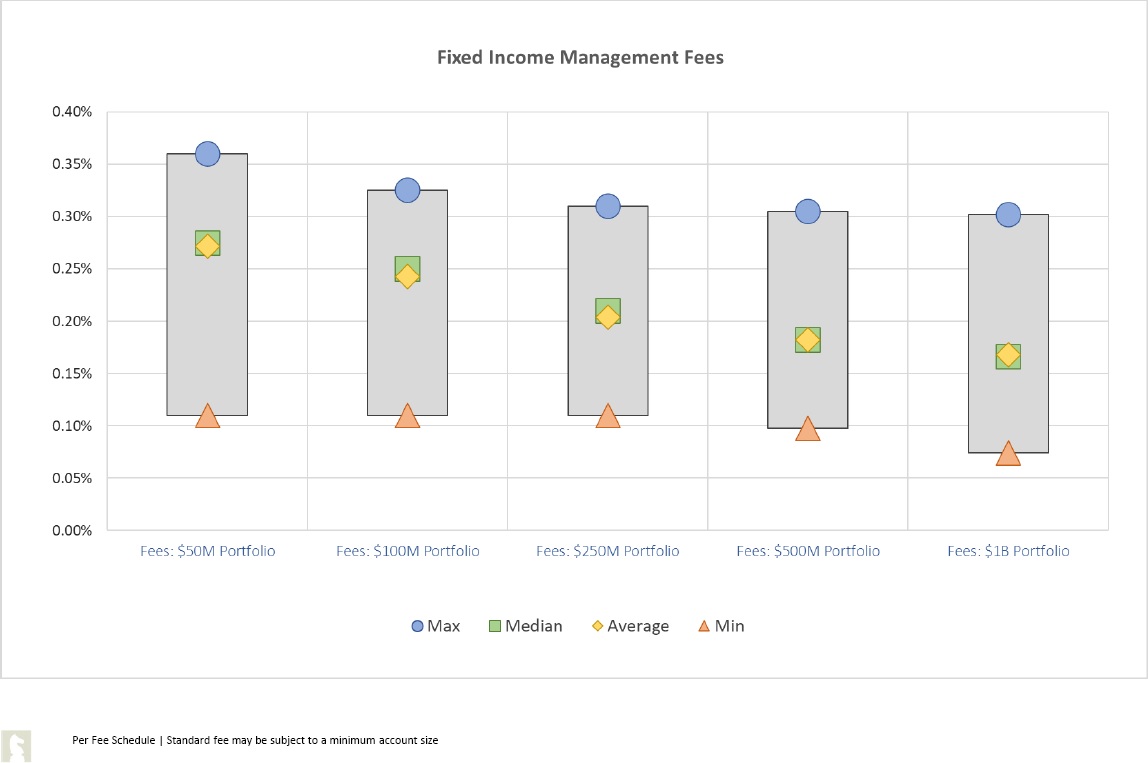
Overall Fee Estimates: By Portfolio Size
Fee Schedules are as of 9.30.21 and are an indication of fees, before negotiation | The database consists of 82 investment management firms, totaling 4,011 insurance fixed income accounts and $5.2T in unaffiliated fixed income assets.
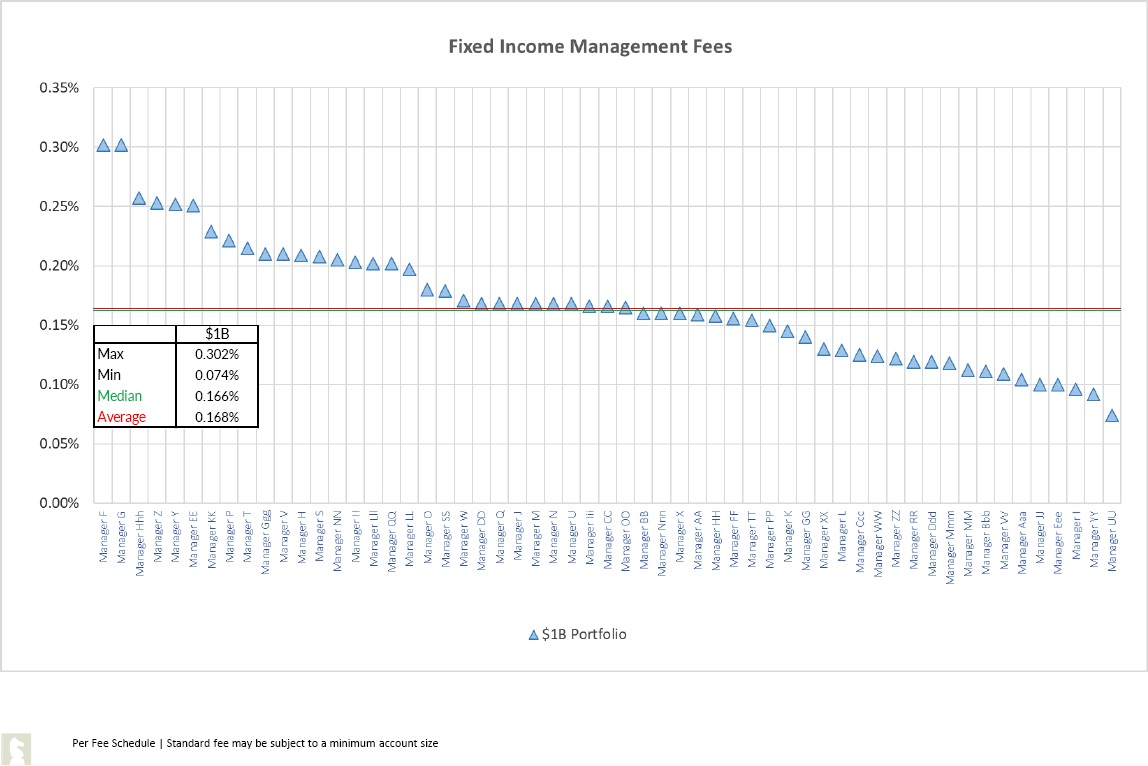
Standard Fee Comparison By Firm
If you’d like to review the fee estimates, based on your organization's portfolio size, for any of these individual firms, you can request access to review our database. Fees are listed in basis points, but can be converted to dollar amount on Manager Select.